Last updated: August 14, 2026
Quick Answer
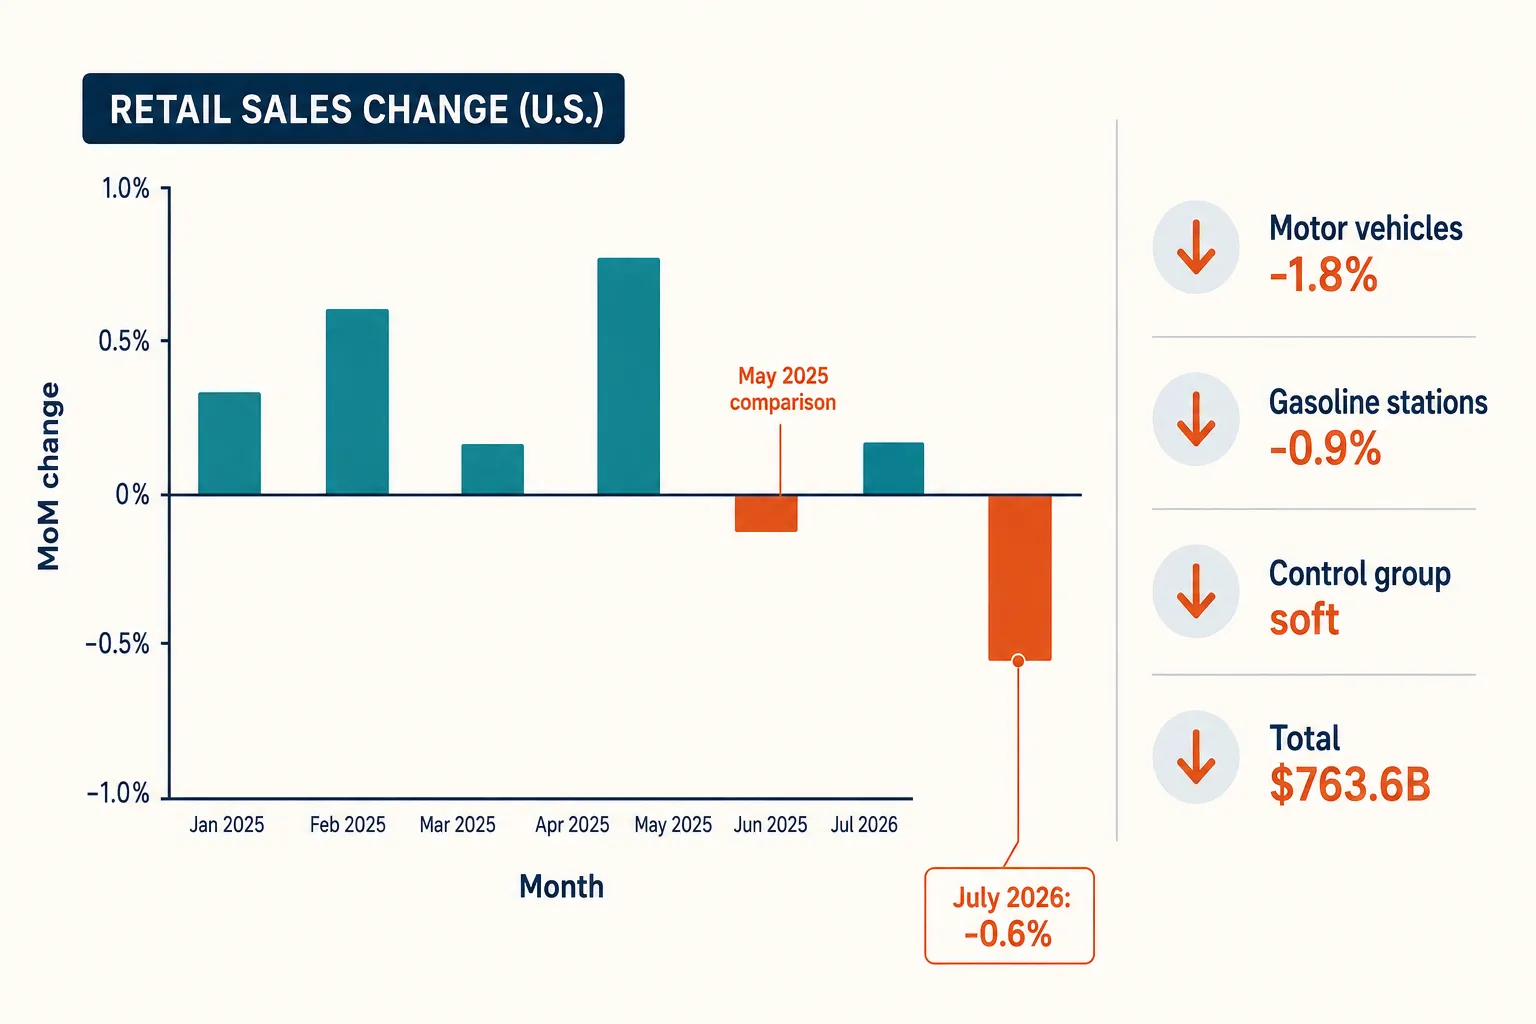
U.S. retail and food services sales fell 0.6% in July 2026 to $763.6 billion, according to the Census Bureau's advance Monthly Retail Trade report released August 14, 2026. That makes the US retail sales drop 0.6% in July 2026 the steepest monthly decline since May 2025, reversing a revised 0.2% gain in June. Sales were still up 5.0% versus July 2025, so the annual trend remains positive even as the month-to-month picture weakened. Motor vehicle and parts dealers led the fall, down 1.8%.
Key Takeaways
- Headline number: retail and food services sales dropped 0.6% month over month in July 2026 to $763.6 billion.
- Comparison point: it is the largest monthly decline since May 2025, per reporting from AP, CNN and Bloomberg.
- June 2026 was revised to a 0.2% gain, so the July fall broke a run of mostly positive months through spring.
- Year over year, July sales rose 5.0%, and the May, July 2026 window ran 6.3% above the same three months of 2025.
- Autos were the weakest major category at -1.8%; gasoline stations fell 0.9% on lower fuel prices.
- Excluding gasoline, spending was still reported down about 0.6%, pointing to weakness beyond fuel prices.
- The "control group" measure that feeds GDP was soft, which matters for Q3 2026 growth estimates.
- One monthly decline is not a recession signal on its own. Payrolls, jobless claims and revisions carry more weight.
- Online sales are counted in the report, under nonstore retailers.
- Retailers heading into holiday 2026 face a consumer who is still spending annually but pausing on big-ticket items.
What caused the US retail sales drop 0.6% in July 2026?
Three forces show up directly in the data: a sharp pullback in vehicle purchases, falling gasoline prices that mechanically cut dollar sales at fuel stations, and a broad softening across most other categories. The Census Bureau report is measured in dollars, not units, so cheaper gas alone drags the headline down even if drivers buy the same number of gallons.
The mechanics break down like this:
- Motor vehicles and parts, -1.8%. The steepest fall among major categories. Auto demand is the most interest-rate-sensitive piece of retail, and it swings hard month to month.
- Gasoline stations, -0.9%. Lower energy prices in July reduced receipts. This is a price effect more than a demand effect.
- Breadth, not just fuel. Even with gasoline stripped out, overall retail spending was reported down roughly 0.6%. That is the detail economists watched most closely, because it means the weakness was not confined to one or two lines.
A common misreading: treating the 0.6% figure as evidence that Americans stopped shopping. Annual growth of 5.0% argues otherwise. The month captured a pause in large purchases, not a collapse in everyday spending.
How does the 0.6% drop compare to previous months?
It is the sharpest single-month decline in about 14 months. June 2026 was revised upward to a 0.2% gain, and the spring months generally ran positive, which is why July stands out as a break in the pattern rather than a continuation of a trend.
| Measure | Figure |
|---|---|
| July 2026 month-over-month | -0.6% |
| June 2026 (revised) | +0.2% |
| July 2026 vs. July 2025 | +5.0% |
| May, July 2026 vs. year earlier | +6.3% |
| Total July 2026 sales | $763.6 billion |
| Last steeper monthly drop | May 2025 |
Read the three-month average before the single month. The 6.3% May, July gain over 2025 is the more stable signal; monthly prints get revised, sometimes materially.
What sectors were most affected by the July 2026 retail decline?
Motor vehicle and parts dealers were hit hardest at -1.8%, followed by gasoline stations at -0.9%. Discretionary categories generally underperformed staples, which is the standard pattern when households tighten.
- Weakest: autos and auto parts, fuel retailers, and other big-ticket discretionary lines.
- More resilient: grocery and health-related retail, where volumes are less flexible.
- Watch item: food services and drinking places. Restaurant spending is the fastest indicator of consumer confidence because meals out are the easiest expense to cut.
Decision rule for analysts: if autos and gasoline explain the entire decline, the month is noise. If the control group is also soft, as it was in July 2026, the softness is broader.
Is the retail sales drop a sign of recession?
No single monthly retail report confirms a recession. A 0.6% decline in one month, against 5.0% annual growth, is a slowdown signal rather than a contraction signal. Recession calls in the U.S. rest on a broader set of indicators, including employment, industrial production and real income.
What would change the assessment:
- Two or three consecutive monthly declines in the control group.
- Rising continuing jobless claims alongside falling retail volumes.
- Downward revisions to prior months rather than upward ones.
For Q3 2026, the practical effect is arithmetic. Consumer spending is roughly two-thirds of U.S. GDP, so a weak July gives the quarter a slow start and pushes forecasters to trim growth estimates unless August and September recover.
Which states and countries saw the biggest declines?
The Census Bureau's advance monthly report is a national estimate and does not publish state-level retail sales. State detail arrives later through the Annual Retail Trade Survey and state tax-receipt data, so any July 2026 state ranking circulating now is an estimate, not official federal data.
For geography, the reasonable expectation is that states most exposed to auto manufacturing and sales, and those with the largest gasoline retail bases, felt the sharpest dollar declines, since those were the two weakest categories nationally.
On international comparison: retail measures are not directly interchangeable. The U.S. figure covers retail and food services in nominal dollars; the euro area and the U.K. publish volume-based retail indices that strip out price changes. A U.S. dollar decline driven partly by cheaper gasoline would not appear the same way in a volume series. Compare year-over-year trends rather than single months across countries.
What do economists predict for August 2026 retail sales?
Most forecasters treat a one-month autos-and-fuel-driven drop as partly reversible, so consensus expectations after a print like July's typically look for a flat-to-modestly-positive August. The August advance report is scheduled for release in mid-September 2026.
Three things will decide it:
- Auto sales rebound or not. Vehicle purchases delayed in July often land in August or September.
- Gasoline prices. If pump prices stabilize, the mechanical drag on the headline fades.
- Back-to-school demand. August captures the second-largest seasonal shopping window of the year.
How does consumer spending affect the stock market and inflation?
Equity markets react to retail sales because consumer spending drives corporate revenue and shapes interest-rate expectations. A weak print can cut two ways: it trims earnings outlooks for consumer-facing companies while strengthening the case for lower policy rates, which supports valuations.
On inflation, the link runs through demand. Softer spending reduces pricing power, especially in discretionary goods, and it lowers the risk that firms pass cost increases through to shoppers. But part of the July decline came from falling gasoline prices, which is disinflation showing up inside the retail number rather than demand destruction. Separating the price effect from the volume effect is the whole exercise.
Retail sales are reported in dollars. When prices fall, the headline can drop even if Americans buy exactly as much as before.
What should retailers do during a sales downturn, and what does it mean for holiday 2026?
The playbook in a soft month is inventory discipline and margin protection, not blanket discounting. Households were still spending 5.0% more than a year earlier in July 2026, so the issue was timing and category mix, not absent demand.
Practical checklist:
- Cut open-to-buy on big-ticket and deferrable goods first; those are what shoppers postponed.
- Protect promotional calendars for peak weeks instead of discounting through a slow month.
- Tighten reorder cycles so slow-moving stock does not carry into November markdowns.
- Watch weekly traffic and basket size separately. Falling baskets with steady traffic signals trade-down, not lost customers.
- Model two holiday scenarios: a flat one and a value-driven one where units hold but average selling price slips.
For holiday shopping season 2026, the July data points to a value-focused consumer who still shows up but concentrates purchases around discount events. Early promotional starts and heavier online mix are the likely responses.
Are online sales included, which retailers struggled, and what about retail jobs?
Yes, online sales are included. The Census Bureau counts e-commerce within nonstore retailers, which covers online-only sellers and catalog operations. Digital orders placed with chains that also run physical stores are generally reported in that chain's store category, which is why the nonstore line is not a complete e-commerce total.
On individual companies: the advance monthly report publishes category aggregates, not company results. Retailer-specific performance for the July period comes from second-quarter and back-to-school earnings calls, several of which land in the weeks after the report. Attributing the 0.6% decline to any named chain is not supported by the federal data.
On employment, retail payrolls typically lag sales by one to three months because scheduling adjusts before headcount does. The first response to a soft month is fewer hours, not layoffs. The signal to watch is seasonal hiring announcements for holiday 2026: if chains announce smaller seasonal classes than 2025, that is the clearest confirmation that retailers read July as more than a one-month pause.
FAQ
How much did U.S. retail sales fall in July 2026? They fell 0.6% from June to $763.6 billion, according to the Census Bureau's advance report released August 14, 2026.
Why is July 2026 described as the steepest drop since May 2025? Because no month between June 2025 and June 2026 recorded a larger single-month percentage decline in retail and food services sales.
Were retail sales still higher than last year? Yes. July 2026 sales were 5.0% above July 2025, and May, July 2026 was 6.3% above the same period a year earlier.
Which category fell the most? Motor vehicle and parts dealers, down 1.8% month over month.
Did cheaper gasoline cause the decline? It contributed. Gasoline stations fell 0.9% on lower prices, but spending excluding gasoline was still reported down about 0.6%.
Does this mean the U.S. is in a recession? No. One monthly decline alongside 5.0% annual growth is a slowdown signal, not a recession confirmation.
Are online purchases counted? Yes, mainly under nonstore retailers, though omnichannel orders can appear in store categories.
When is the next report released? The August 2026 advance retail sales report is scheduled for mid-September 2026.
Is state-level data available for July 2026? No. The advance monthly report is national only; state detail comes later from annual surveys and state tax data.
What is the control group? A core measure excluding autos, gasoline, building materials and food services. It feeds GDP consumption estimates and was soft in July 2026.
Conclusion
The US retail sales drop 0.6% in July 2026, steepest since May 2025, tells a narrower story than the headline suggests: autos fell 1.8%, gasoline receipts fell 0.9% on cheaper fuel, and the rest of retail softened modestly while annual growth held at 5.0%. The number that matters most for Q3 2026 is the control group, and it was weak.
Next steps for readers tracking this: check the August advance report in mid-September for an autos rebound, watch holiday seasonal hiring announcements as a read on how retailers themselves interpret July, and compare the three-month average rather than any single month before drawing conclusions about the American consumer.
Tags: US retail sales, July 2026 retail sales, consumer spending, Census Bureau retail report, retail sales decline, Q3 2026 economy, motor vehicle sales, gasoline prices, recession indicators, holiday shopping 2026, e-commerce sales, retail employment