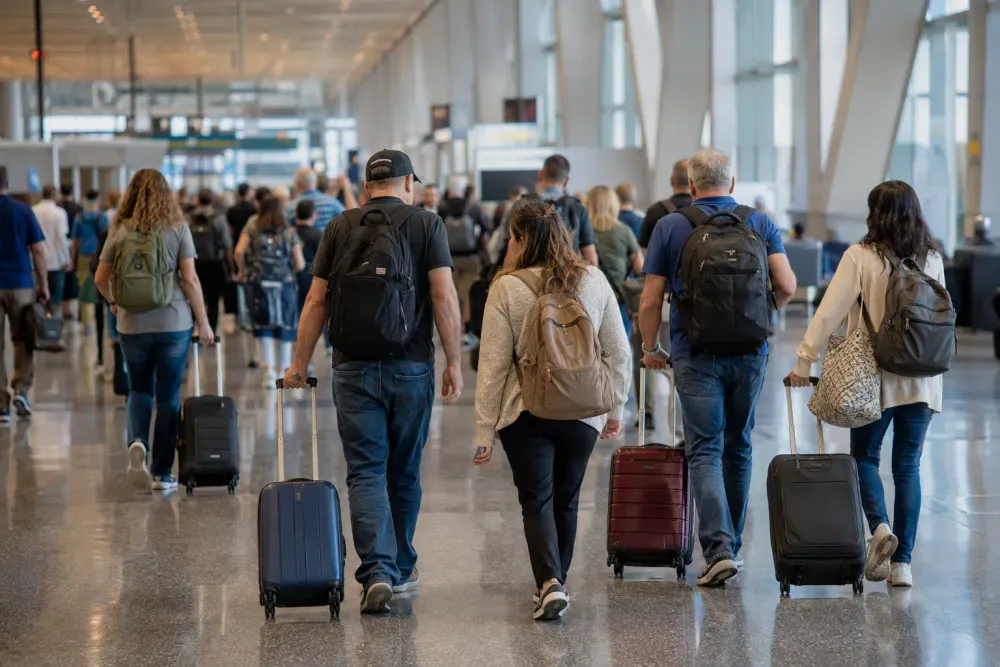
Domestic hotel bookings for the 2026 Labor Day weekend cost 9% more than a year ago, while cruises leaving U.S. ports cost 4% less, according to new AAA booking data that captures a widening divide in what Americans will pay for their final major trips of summer.
The AAA analysis covers travel from Sept. 3 through Sept. 7 and finds that domestic round-trip airfare averages $750, up 2% from the comparable 2025 holiday period. Flights to the most popular U.S. destinations average nearly $790, almost 20% more, and international hotel bookings are 12% more expensive. Yet international airfare is down 4%, domestic car rentals are down 8%, and cruises departing domestically average $2,700 per booking, 4% less.
The contrasting prices are more informative than a single declaration that travel has become either cheaper or more expensive. They show a holiday market in which location, booking mix and the amount of capacity available matter as much as the broad direction of inflation. They also require caution: AAA is reporting prices in its own booking data, not a census of every reservation or a forecast of the total number of Americans who will travel.
Hotel and Airfare Prices Are Moving on Different Clocks
A hotel room and an airline seat are both perishable inventory, but suppliers manage them differently. Airlines can shift aircraft, adjust schedules and sell connecting itineraries across large networks, while a hotel cannot move a room from a weak market to a city where demand is surging. When travelers concentrate in Seattle, Orlando, Boston, Denver and New York, the leading domestic destinations in the AAA data, local room supply can tighten even if national lodging demand is less exceptional.
The holiday sample also differs from the government’s broad monthly price measures. The Bureau of Labor Statistics reported that the national airline-fare index rose 2.2% in July while lodging away from home fell 2.8% over the month, according to the latest CPI release. AAA’s Labor Day bookings show hotels rising year over year for a particular set of dates and customers. Both can be accurate because they measure different universes, comparison periods and reservation mixes.
That distinction is especially important for the nearly 20% increase on flights to the most popular domestic destinations. It does not mean every domestic ticket is 20% more expensive; AAA’s overall domestic average is up only 2%. The larger figure reflects routes drawing the most holiday interest, where carriers can face concentrated demand and fewer last-minute seats even while international routes, taken as a group, are 4% cheaper than last year.
Cruises Gain an Edge by Bundling the Vacation
The cheaper cruise figure points to a different form of competition. A cruise fare combines transportation between ports, lodging, meals and much of the entertainment, allowing travelers to compare one large package price with several separate land-vacation bills. Cruise operators also added ships and itineraries during the post-pandemic expansion, creating inventory that must be filled even when airfare and hotel prices rise.
AAA’s more detailed regional booking data put the average domestic-departure cruise at $2,700, compared with $4,690 for cruises leaving foreign cities. The latter are 16% more expensive than last year, illustrating that “cruise prices” are not moving uniformly. An international departure can add long-haul flights and may draw from a different mix of itineraries, cabin types and trip lengths.
Alaska sailings help explain why Seattle, Anchorage and Vancouver rank prominently in the holiday destination lists. Those cities function as gateways rather than merely endpoints, while Denver and Las Vegas feed trips to Rocky Mountain, Arches, Zion and Grand Canyon national parks. The National Park Service recorded more than 323 million recreation visits in 2025, including more than 13 million overnight stays, confirming the durable scale of outdoor travel even though those annual totals do not measure Labor Day demand by themselves.
Road Trips Carry a New Fuel Penalty
Travelers who avoid airfare still face a substantially higher fuel baseline. The U.S. Energy Information Administration reported an average regular gasoline price of $4.085 a gallon for the week of Aug. 24, up 93.8 cents from a year earlier. The EIA data show prices rising 3.6 cents in a week, with the East Coast at $3.921 and New England above $4.
Fuel therefore changes the arithmetic for the shorter regional trips that households often use to control costs. A 500-mile round trip in a vehicle averaging 25 miles per gallon consumes about 20 gallons; at the national average, fuel alone would cost roughly $82, before tolls, parking or vehicle wear. That calculation is illustrative rather than a forecast, but it shows why cheaper rental rates do not necessarily translate into a cheaper road vacation.
AAA says domestic rental-car bookings average $450, 8% less than last year, and international rentals average $730, down 15%. Those reductions may reflect fleet supply, length of rental and the locations included in the sample. They partially offset fuel costs, but they cannot erase the regional variation in gasoline prices or the congestion costs that arrive as holiday drivers mix with Thursday and Friday commuters.
Crowds Will Test Airports and Highways
The latest price data do not provide a national traveler count, but other indicators show a system operating at sustained high volume. The Transportation Security Administration’s public checkpoint series recorded 1,938,948 screenings on Aug. 25 and is updated on weekdays, allowing travelers and analysts to compare daily throughput with earlier years. Screening totals measure people passing checkpoints, not unique vacations, and they do not include road or rail trips.
The Federal Aviation Administration said before the summer that it expected 5.4 million flights from Memorial Day through Labor Day. Its summer tracker also reports 118 engineered-material arresting systems at more than 60 airports, one example of the infrastructure operating behind passenger schedules. High traffic alone does not imply unsafe operations, but full planes and tightly timed connections give airlines and airports less room to absorb thunderstorms, staffing constraints or equipment problems without cascading delays.
On highways, transportation-data provider INRIX expects the most difficult periods to fall between 2 p.m. and 7 p.m. Thursday and noon to 8 p.m. Friday. The forecast reflects a compressed holiday window in which leisure traffic joins ordinary weekday commuting. It is a model-based expectation rather than a guarantee for every road, and actual delays will depend on weather, crashes, construction and the route travelers choose.
The Booking Data Show Tradeoffs, Not a Universal Price Trend
For consumers, the clearest implication is that the traditional categories of “domestic” and “international” are too broad to identify the least expensive trip. International airfare is cheaper in AAA’s sample, but foreign hotels cost more. Domestic cruise departures are cheaper, but international cruise departures are sharply higher. U.S. rental cars cost less, while gasoline costs nearly a dollar more per gallon than last year.
The same caution applies to destination rankings. Seattle leading the domestic list may reflect Alaska cruise departures, while Denver’s position includes travelers continuing to national parks. A booking in a gateway city does not necessarily measure where a traveler spends most of the holiday, and an average booking price does not reveal cabin class, hotel quality, party size or trip duration. Those unknowns limit comparisons across products.
The new data nevertheless establish a meaningful change in the Labor Day market: travelers are confronting higher prices for the lodging and domestic flights most exposed to concentrated holiday demand, while finding relief in products with more available capacity or different economics. What remains unknown is the final volume of trips and whether weather or operational disruptions will alter the pattern. The most useful evidence next will be daily TSA screenings, actual roadway congestion and post-holiday airline and hotel performance, which can show whether strong booking interest became completed travel.